 |
 |
|||||||||||||
|
|||||||||||||
|
|||||||||||||
|
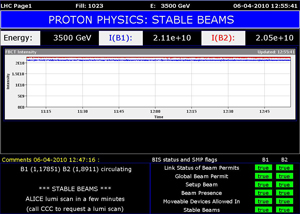
On days when the LHC makes front page news, some web pages get more attention than they usually do. A page that is highly frequented by LHC operators, on display in all control rooms and a favourite link for physicists, but otherwise not all that well known, is LHC Page 1 (aka OP Vistars). One quick look gives you all the important information on the status of the machine. ILC NewsLine wanted to find out: what would an ILC Page 1 look like? To find out, we first need to have a look at the LHC's Page 1 to understand what it says. The screenshot taken this week loudly declares that 'Proton Physics' is going on: 'stable beams' means that these beams are stable enough to collide without posing a risk to the detectors around the interaction point and that beams are colliding, delivering data &mdash or 'physics' to the scientists. The page also tells us more about the characteristic of the two beams: they have an energy of 3500 GeV, and different intensities – numbers of protons – that are also plotted in the central diagram. The bottom left corner is reserved for current news from the operators to the detectors. The screenshot message informs them that the two beams are circulating stably and that the operators are ready to let the ALICE-experiment perform a luminosity scan on the beam (for which they should call the CERN Control Centre or CCC). The bottom right corner shows the many flags for example for the cryogenic system, the beam permit — they are a bit like traffic lights; if a flag is on red no beam can go through. All green means that beam is allowed into the machine and is actually present that very moment. The ILC, needless to say, would never declare 'proton physics' with its colliding beams of electrons and positrons. But could it declare 'stable beams'? Not in the LHC sense: the ILC sends its particles down its roughly 30 kilometres of linear accelerator for one shot only — no circulating beams in a linear machine! It would therefore declare the repetition rate: the number of bunch trains per second, the pulse of the machine. It would also tell its viewers the energy of the particles, and probably the number of bunches per bunch train, and the number of particles (or charge) per bunch. “The central diagram for physics operation at the ILC would most likely show the luminosity plotted over time,” thinks project manager Nick Walker, “and possibly things like the energy spread of the beam over time.” The luminosity plot is one step further than the intensity plot shown on LHC's page one because it contains the actual information on the rate of collisions whereas the intensity indicates potential collisions. As there is only one interaction point at the ILC, the luminosity information could be fed straight back from the detector taking data at that time. The graph would look very different, however, as beam intensities and energies are likely to be less uniform in the pulsed ILC — every beam emerging from the damping rings is a new adventure. There could even be more information on an ILC Page 1. “We could probably feed info from the damping rings or other sub-systems onto the page, giving direct measurements of for example the beam emittance or include info from the fast feedback systems,” hypothesises Walker. Of course the ILC does not need an operations team yet, so there are no drafts for this kind of webpage for the ILC yet. The info box for detectors could contain a countdown to the next push-pull, where the two detectors switch positions and one moves away from the interaction point while the other moves in. Or there could be the rate of polarisation of the particles. “But the most important thing is: many collisions,” concludes Karsten Buesser from DESY, expert on the machine-detector interface. -- Barbara Warmbein
Learn more about the LHC's Page 1 display in the CERN Bulletin or symmetry breaking.
|
|||||||||||||
| © International Linear Collider |
