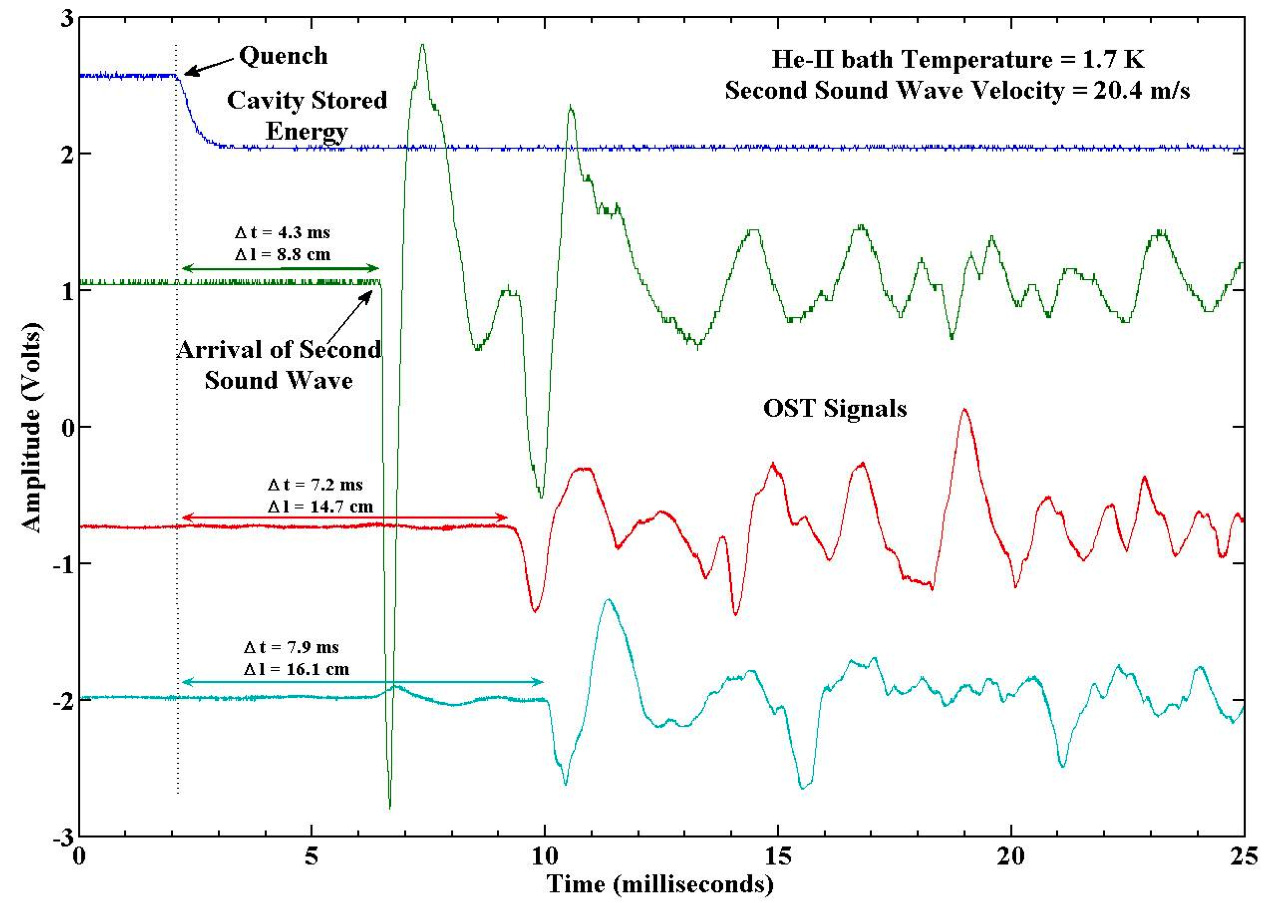
A read-out of the sensor signals. The top curve indicates the onset of the quench, when the cavity’s transmission power goes to zero. The second, third and fourth curves show when the temperature wave, propagating through liquid helium, reaches three different sensors. The precipitous drop in each curve indicates the arrival of the wave for that sensor. Image courtesy of Georg Hoffstaetter.
The sound of accelerator cavities
Copyright © 2026 ILC International Development Team
Printed from http://newsline.linearcollider.org
Printed from http://newsline.linearcollider.org

