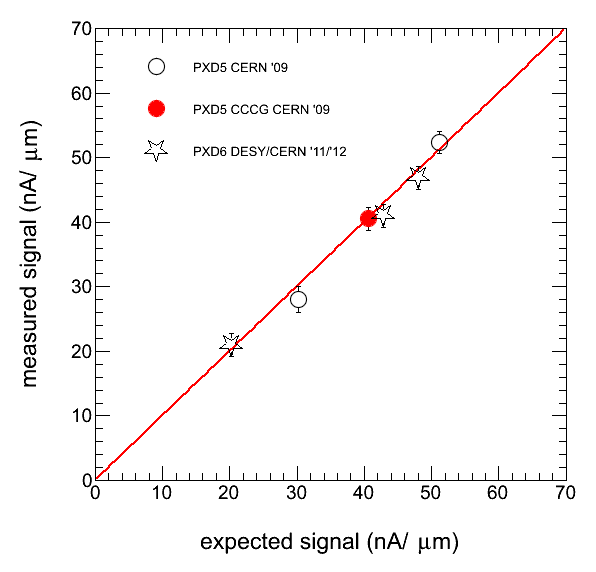
Figure 1: The signal (drain current) in response to minimum ionising particles traversing the sensor. The result is normalised to the thickness of the detector and plotted versus the expected gain. The markers correspond to different detector designs.
DEPFET active pixel detectors for the linear collider
Copyright © 2026 ILC International Development Team
Printed from http://newsline.linearcollider.org
Printed from http://newsline.linearcollider.org

